


A Way Forward for Wyndham: Advocacy for What Matters
Article


Social Researcher
Each year, the State of Origin NRL series invites Australians to choose a side and think back to where they were born: their state of origin.
New South Wales (NSW) or Queensland (Qld). Blue or Maroon.
The rivalry is embedded in Australian sporting culture, particularly along the East Coast, and comes into sharp focus each winter. This year is no exception, with the series once again heading to a decider on Wednesday, 8 July.
But when it comes to liveability, the rivalry largely disappears.
Survey results from Informed Decisions' annual Living in Australia study, conducted in April and May 2026 with 5,325 Australians, including 1,345 residents from NSW and 970 from Qld, show that residents in both states value many of the same things and face many of the same challenges.
The real rivalry isn't between NSW and Qld. It's between different types of places within these states: metropolitan and regional communities, fast-growing and established areas, coastal towns and capital cities. The Living in Australia study captures eight regions across NSW and Qld, allowing us to compare how liveability varies not only between the states, but within them.
Within the Living in Australia study, survey respondents are presented with sixteen liveability attributes and asked to identify the five they believe are most important in making somewhere a good place to live. They are then asked to rate, on a scale from 0 to 10, how they experience these same attributes in their local area.
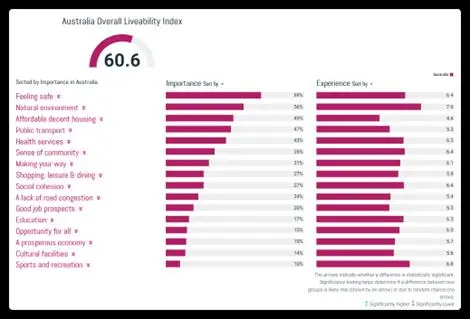
Overall, residents in both NSW and Qld consistently rank feeling safe, affordable decent housing and access to high quality health services among their most important priorities, with access to the natural environment close behind almost everywhere.
What changes is the fifth priority. In the cities, including Greater Sydney and South East Qld, it's reliable public transport. Across regional NSW and Qld, it's a strong sense of community. Even residents' priorities, it seems, are shaped by where they live.
Residents also point to broadly similar priorities for improvement.
Housing affordability stands out in every region, recording one of the widest gaps between how highly residents value it and how they rate it locally.
Beyond that, the picture begins to shift. Reliable and efficient public transport emerges as a major gap across metropolitan communities, while access to high quality health services is the more pressing challenge across regional NSW and Qld.
At first glance, and much like the result of Game One of this year's series, NSW appears to be in the lead, recording an Overall Liveability Index score of 61.0 compared with Qld's 58.4.
But without the full context, that result only tells half the game.
Within NSW, Overall Liveability Index scores range from 58.2 in Northern NSW to 63.6 in Southern NSW. In Qld, scores range from 56.9 in North Qld to 59.3 in South East Qld.
In other words, the place where you live within a state has a greater impact on liveability than which state you live in.
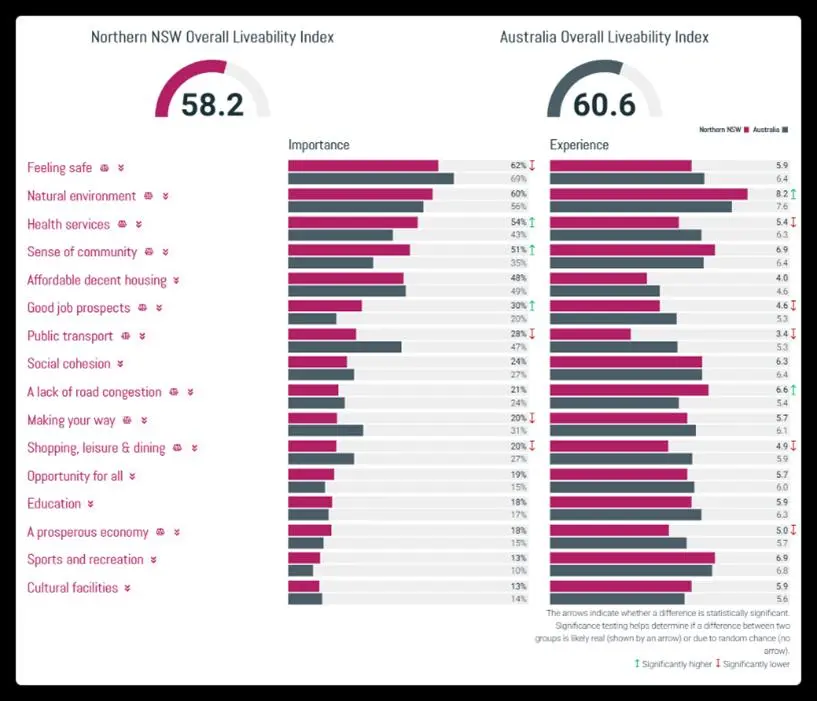
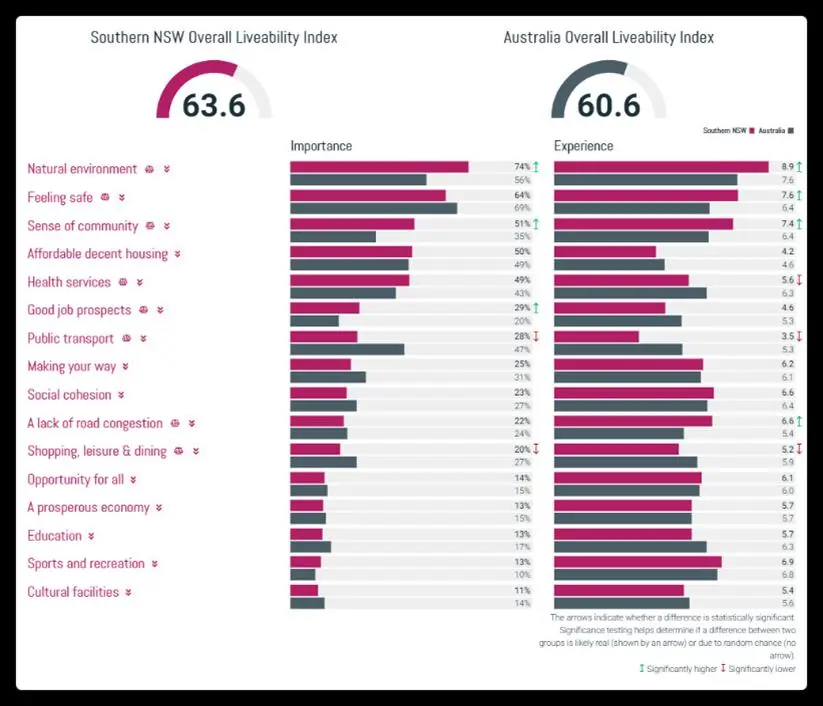
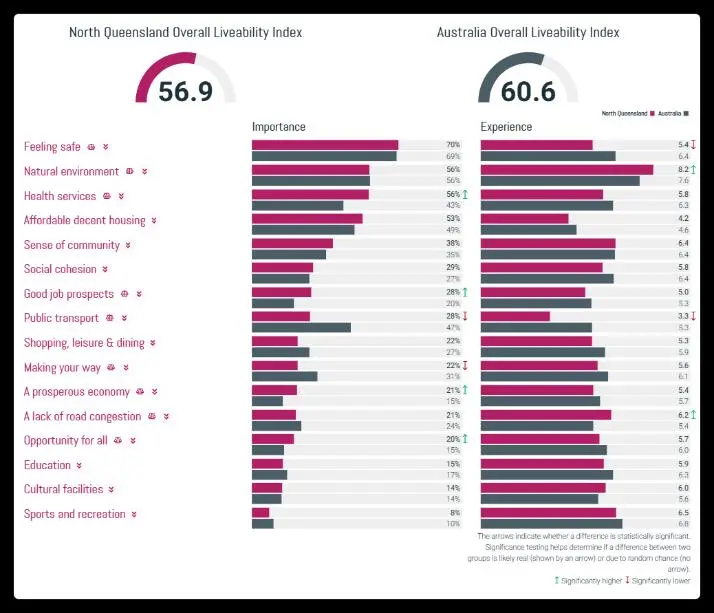
The differences that emerge are driven by local circumstances rather than state borders.
Greater Sydney performs strongly on public transport and ease of access to services, reflecting the advantages of a large metropolitan centre.
Southern NSW records the highest Overall Liveability Index score of any region across either state, driven by stronger perceptions of safety, sense of community, and access to the natural environment.
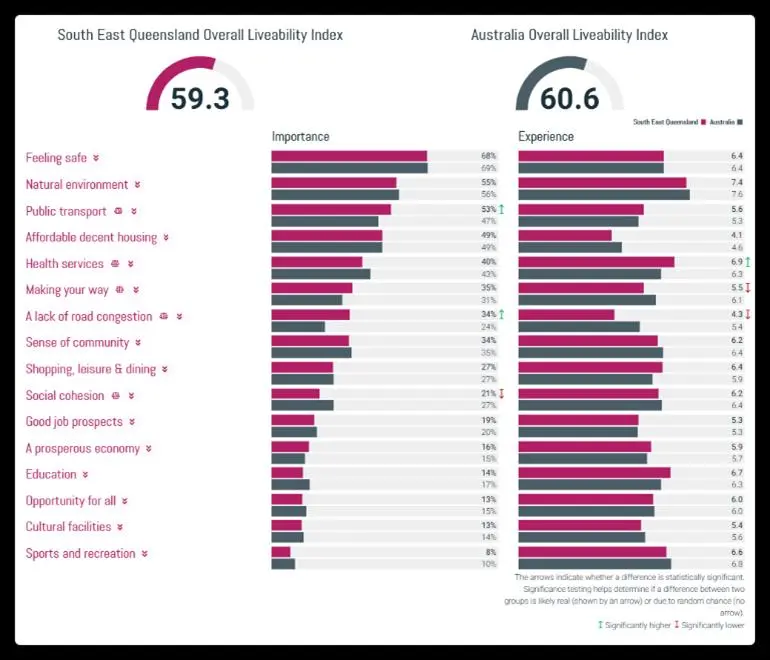
In Qld, South East Qld performs strongly across perceptions of safety, sense of community, the natural environment and health services, while North Qld's strengths lie in its natural environment and lack of road congestion.
These patterns come into even sharper focus at the local government level, where councils across Australia use Informed Decisions' Community Views survey to better understand the communities they serve. The examples below draw on Community Views surveys conducted between 2024 and 2026. While they span different years, they illustrate the same principle emerging from this year's Living in Australia results: highly liveable places are not created in the same way.
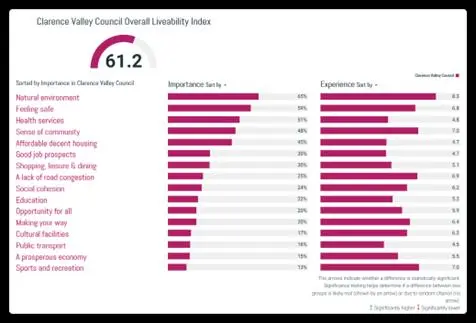
In Northern NSW, Clarence Valley Council provides a good example. Residents report strong experiences of access to the natural environment, feeling safe and a strong sense of community, contributing to an Overall Liveability Index score of 61.2. At the same time, access to high quality health services remains a clear area for improvement, ranking among residents' highest priorities but much lower for their lived experience.
A different story emerges in South East Queensland. In the City of Moreton Bay, residents also place a high value on and report positive experiences of access to the natural environment. However, rapid population growth is placing increasing pressure on road congestion. While road congestion is the third most important liveability attribute, it ranks last for residents' experience, highlighting the growing challenge of keeping infrastructure in step with population growth.
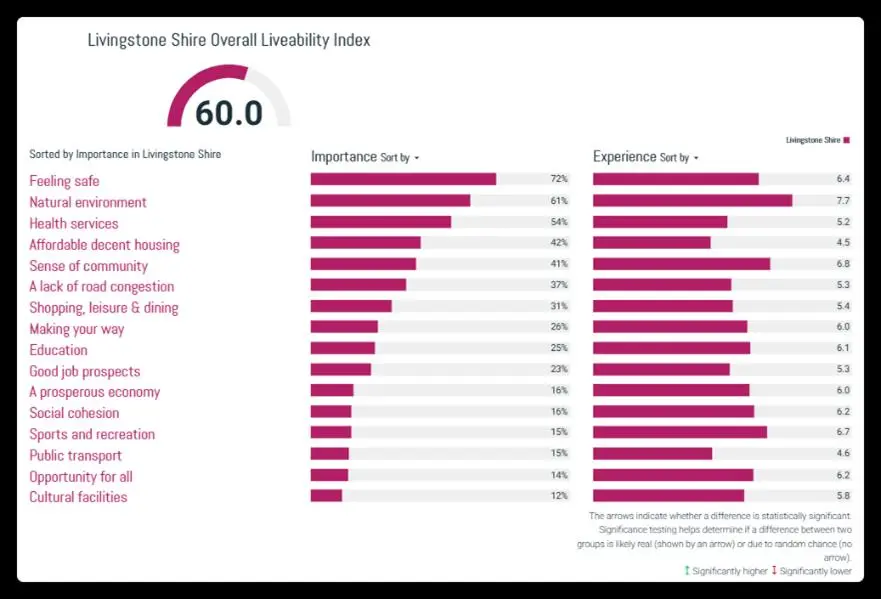
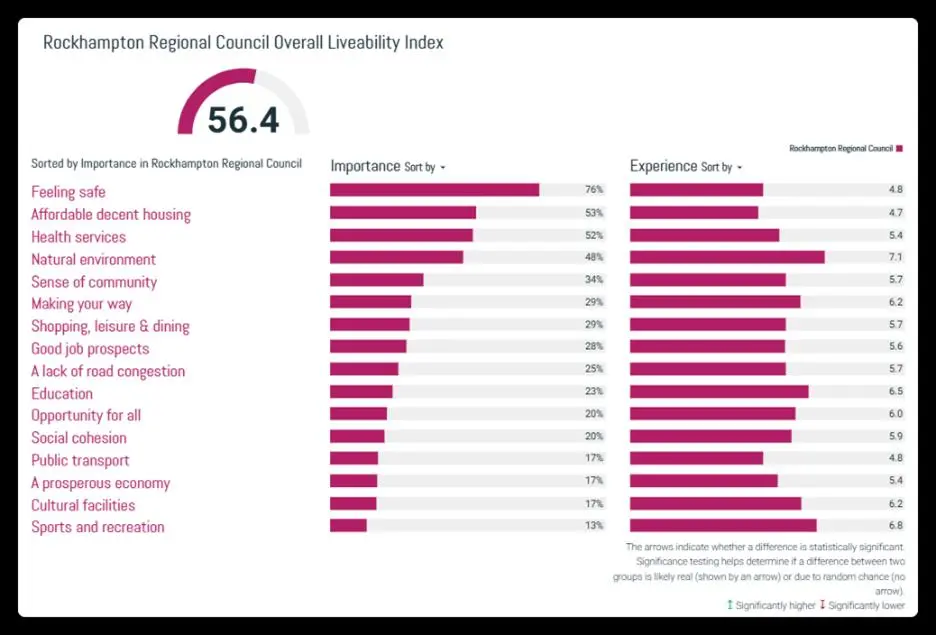
Central Queensland demonstrates that even neighbouring communities can have very different liveability stories. In Livingstone Shire, residents' experience is shaped by the area's coastal natural environment, with access to the natural environment emerging as both a key priority and one of the community's greatest strengths. Next door in Rockhampton Regional Council, the conversation shifts to community safety. Feeling safe is the community's highest priority but among the lowest rated experiences, while law and order is the dominant local concern. Two neighbouring communities, markedly different priorities.
These examples reinforce that there is no single playbook for creating a highly liveable place.
Some communities perform strongly because of their transport networks and access to services. Others excel through their natural environment, strong sense of community or perceptions of safety.
Understanding these local strengths, challenges and priorities is ultimately more valuable than simply comparing overall liveability between the two states.
The State of Origin decider will divide residents from NSW and Qld for another 80 minutes.
But when it comes to liveability, the more meaningful rivalries aren't state based. They're found between metropolitan and regional areas, fast-growing communities and established ones, coastal towns, and capital cities.
At Informed Decisions we specialise in helping organisations understand place. Through our Community Views service, we support all levels of government, and private sector organisations to understand the unique strengths, challenges and aspirations of local communities.
The annual Living in Australia study demonstrates why this matters. There is no single playbook for creating a highly liveable place. Every community has its own strengths, challenges and priorities. Understanding them is the foundation of making informed decisions that create better places.
The Living in Australia study shows the national picture, but the real story plays out suburb by suburb. Explore the results, dig into the data behind them, or see how councils turn resident insight into better places.
Explore the 2026 Living in Australia results or learn more about our National liveability dataset and the Community Views service.


