


Rebased population estimates – big changes to your LGA population
Article


Lead Demographer – Customer Success and Support
It's a common misconception that the Census tells us the population of Australia, or of any place within it. The Census is the basis for the population count, but the count itself is always a little different from the official population figure, the ERP or Estimated Resident Population.
If you’re wondering ‘Which population number do I use?’, the short answer is: use the ERP. It is the official population, it is what grant and funding formulas are built on, and it is the figure to quote in a strategy, a submission or a media release.
The Census counts answer different questions, and our guide to enumerated data, usual residence and ERP sets out when to reach for each. The rest of this article is about the ERP: where it comes from, why it keeps changing, and what that means for you over the next two years.
The ERP is the official population of any area. The ABS calculates it annually, with a reference date of 30 June for everything smaller than a state or territory, and quarterly (March, June, September and December) for the states, territories and total Australia, in National, State and Territory Population.
That release runs on its own schedule. The dates do not line up with the Census, which falls in early August every five years (on 11 August in 2026). Estimates normally come out around six months after the end of the quarter, so December quarter figures appear in June.
The 30 June figures for smaller areas, meaning Local Government Areas, SA2s and other standard geographies such as capital city regions, come out around the end of March each year in Regional Population. That is when we can finally settle the question of whether Melbourne's population has overtaken Sydney's.
Though most of the information in our Community Profiles uses Census as its source, the number on the home page will always show the latest ERP, currently 30 June 2025. That number will change over the next couple of years as the 2026 Census works its way through the system.
Every five years the Census gives us two counts. Usual residence is where someone usually lives, or intends to live for six months or more. Enumerated is where they happened to be staying on Census night.
| Measure | What it tells you |
|---|---|
| Estimated Resident Population (ERP) | The official population. It is built on a usual residence basis, then adjusted for the people the Census missed, for residents who were overseas on Census night, and to a 30 June reference date. Use it whenever you need the official figure, including for funding and grant submissions. It is an estimate rather than a count. |
| Enumerated | Where each person was counted on Census night, which may not be where they live. Use it for questions about who was present in an area on a particular night. |
| Usual residence | Where people said they usually live, meaning the address they have lived at, or intend to live at, for six months or more in the Census year. Particularly useful for understanding where people typically live, because it takes out the distortions caused by anyone who was away on Census night. |
The two Census measures, usual residence and enumerated, overlap for about 95 per cent of people, who are counted at home anyway.
The Census is never a 100% accurate count of the population, and 2021 shows why in two different ways.
Around 96 per cent of households responded (96.1% to be precise). The ABS imputes the other four per cent based on other information about who is likely to live in a ‘non-responding dwelling’.
That imputation is itself a source of double counting. Some non-responding dwellings turn out to have been unoccupied at the time, with their usual occupants already counted somewhere else, at a holiday house, with family, or travelling.
About a month after Census night the ABS runs a Post-Enumeration Survey, a random sample of households used to work out the net effect of all this missing and double counting. It is not used to identify or fine anyone who missed the Census, only to measure the gap.
For 2021 the result was a net undercount of 0.7 per cent nationally, one of the most accurate Censuses in the world. Most states showed a net undercount. The ACT had a net overcount, meaning more people were counted twice there than were missed altogether.
Adding in the undercount, plus people known to be overseas on Census night from passenger card data, a group that was unusually small in 2021 given COVID travel restrictions, gives a Census-night ERP.
That figure is never actually published. Because ERPs are always dated to 30 June, the ABS then adjusts it back about five to six weeks, subtracting the births, adding back the deaths, and removing the net overseas migration that occurred in between, to land on the 30 June figure.
Each year after that the process runs in reverse. The ABS takes the previous year's ERP and rolls it forward by:
The result is the annually revised ERP you see on the Informed Decisions sites. Each year also brings minor revisions to the previous year or two's figures, but none of it is final until after the next Census.
In 2027, following the 2026 Census, there will be two versions of the population for the same date, 30 June 2026, at small-area level: one pre-Census, and one rebased on the 2026 Census. The timeline runs like this.
The usual annual update, rolling forward the previous year's figures, themselves built by adding five years of change to the 2021 Census-based ERP. This figure does not reference the 2026 Census results at all, but is still built on the 2021 base, which can cause a lot of confusion as it comes out well after the Census was actually run. It is also the furthest point from a Census in the whole cycle, which makes it the least reliable figure in the series.
After the main 2026 Census data release, which gives usual-residence counts rather than the official population (ERP), the ABS releases a preliminary rebased set: new 30 June 2026 figures based on the 2026 Census itself.
At the same time, the previous five years, back to 2022, are rebased as well. We update the Informed Decisions sites to match. Expect the Census counts (usual residence) and the ERP for the same year to differ noticeably when you first put them side by side, before the re-based numebrs are published by the ABS. That is normal.
About a year later, in 2028. The ABS makes final, minor tweaks to the 2022 to 2026 figures, which then become final and never change again. The first annual update for 2027 arrives around the same time, in March 2028, and the cycle starts over.
Our 2026 Census hub has the full release timeline.
If that sounds convoluted, it is. But it produces the most reliable population figures (albiet in hindsight).
It also means a given year's ERP can keep changing for up to six years after the Census it is based on. The 2022 figure, for instance, can still move right through to 2028, though usually only by a small amount.
Of course, we don’t know for sure until the numbers are out. The Census-based revision can be substantial, but it is worth knowing what normal looks like. At state level a rebase is usually within the tens of thousands, but rarely as much as 100,000.
The 2021 round was an unusually large one, distorted by COVID: Tasmania's population was revised up by 27,000 people, or 4.9 per cent of the state, which is an exceptional result rather than a typical one, while Victoria's was revised down by 101,000, or 1.5 per cent (Centre for Population, Rebasing Australia's population estimates using the 2021 Census).
That flows through to every local area estimate in those states, and some individual councils moved a long way. The important thing to note is these are revisions to previous estimates, not a sign of actual population change in each place.
The part that matters for you is that every level of geography gets revised, and they do not all move the same way. After the 2021 Census New South Wales was revised down by around 50,000, and yet Blacktown, one of its largest Local Government Areas, was revised up. Your state's headline number tells you very little about what will happen to your own figure. Do not read the state result and assume yours follows it.
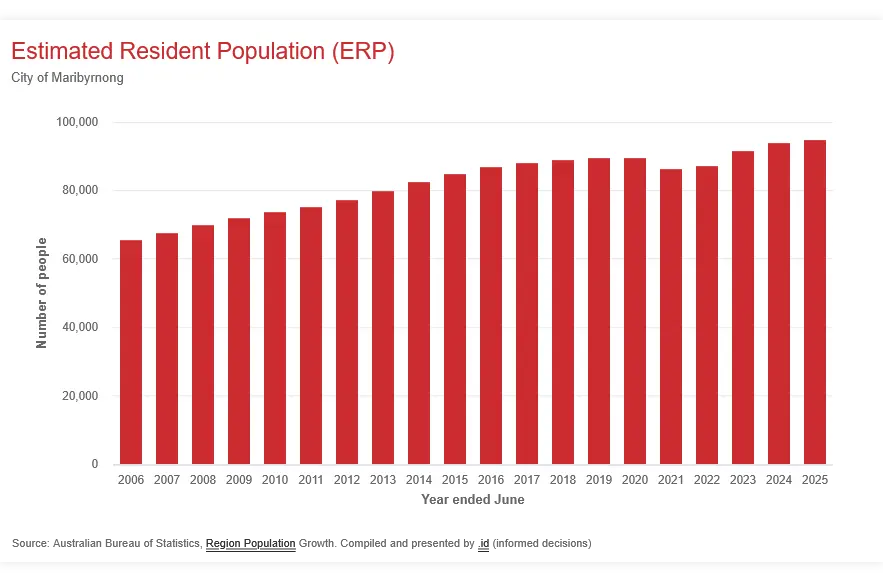
This chart from Community Profile shows the City of Maribyrnong in Melbourne, and 20 years of population estimates. It shows the clear dip when populations declined in Victoria during COVID, a dip that wasn't picked up until after the 2021 Census. On this chart, the numbers for 2022 to 2025 are still subject to change after the 2026 Census release.
Over the next year, two different population figures will be released for your area as at 30 June 2026. The first is based on the 2021 Census count, plus adjustments. The second will be based on the 2026 Census count (also with adjustments).
The two numbers will likely not align. This can cause some confusion within your organisation, espeically if you jump to publishing and promoting documents based on the first release. Here’s how we suggest you approach it:
Treat it as a first cut. It is a sound figure for routine reporting and for tracking year on year, but it is the furthest point from a Census in the whole cycle. If it is going into a strategy or a funding submission, name the release you used and note that a rebase is coming (you can link to this article if you need an explainer).
This is the one to plan around. It resets 2022 to 2026 in one go, so your recent trend can change shape as well as the current population count.
Once the rebased figures are out, you can refresh the baseline figures in your strategies, your monitoring frameworks and anything you report to councillors or other stakeholders.
2028, the final figures
These never change again. Use them for evaluation, for anything that needs a stable series, and for the long-run comparisons you do not want to have to redo.
Informed Decisions Population Forecasts always match the population at the base Census year, currently 2021, within small rounding adjustments.
Forecasts are completed progressively around the country, so each one will generally match the latest ERP that was current when it was completed.
Because of the small annual revisions to the ERP, there can be differences between a forecast and the current ERP simply because the ERP has moved since the forecast was published, or because the underlying assumptions in the forecast have changed as conditions have changed or new information has become available, produce different population outcomes.
In some cases we cannot match the interim ERP figures, but often find we have matched the Census-based revision better than the preliminary numbers once it comes through. None of these small differences change how useful the forecasts are for planning.
If you would rather not track all of this, you do not have to. We update the Informed Decisions sites as each release becomes available, including the full rebase, so the population figure on your Community Profile is always the current official one.
Here is the order the releases arrive in, and which Census each one is built on. The base does not change at Census night. It changes in the middle of 2027.
| When | What is published | Built on |
|---|---|---|
| March 2026 (already out) | ERP at 30 June 2025, the figure on your Community Profile today | 2021 Census |
| 11 August 2026 | Census night. Your published population does not change | Not an ERP release |
| March 2027 | ERP at 30 June 2026, the usual annual update. Treat it as a first cut | 2021 Census |
| Mid 2027 | 2026 Census usual residence counts, which are Census counts rather than the official population | 2026 Census counts |
| Around July 2027 | Rebased ERP at 30 June 2026, the second version of the same date | 2026 Census |
| Around July 2027 (same release) | Official ERP for 2022 to 2026 revised onto the new base, so your recent trend can change shape | 2026 Census |
| March 2028 | ERP at 30 June 2027. The normal annual cycle resumes | 2026 Census |
| During 2028 | Final figures for 2022 to 2026, after which they never change again | 2026 Census |

