


Can Your Local Workforce Sustain Future Aged Care Demand?
Demographics


Demographer
Australia’s birth rate is declining, and we are having children later in life – but that’s not true of everywhere in Australia.
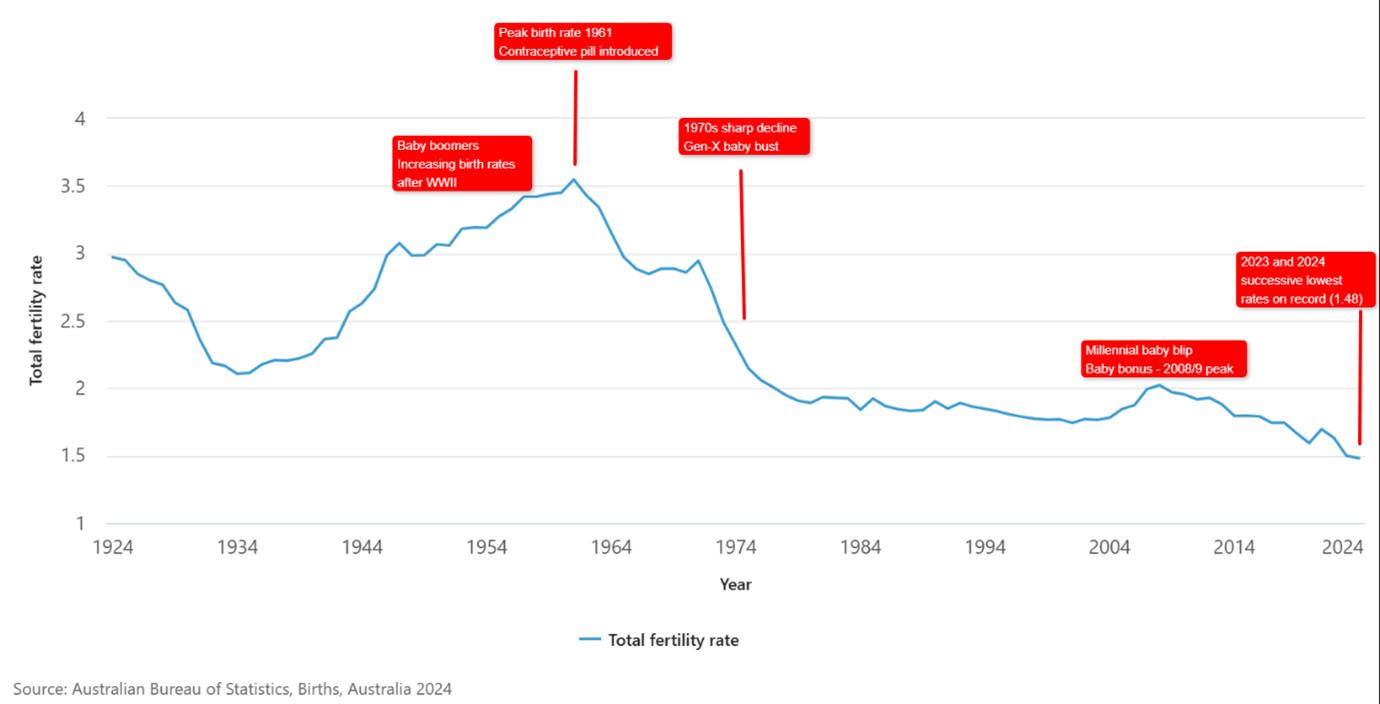
According to data recently released by the Australian Bureau of Statistics, the number of total births registered in Australia in 2024 rose, but not by enough to offset (yet) another small fall in the fertility rate - or the average number of children a woman will have in her lifetime based on the current age-specific birth rates. This number has fallen to a new record low of 1.48 (from 1.50 last year).
You may be familiar with the idea of the ‘replacement level’, or the average number of children a woman needs to have for a population to replace itself from one generation to the next.
That’s usually defined as a fertility rate of 2.1, though our very low infant mortality rate might mean we could actually replace our population with a slightly lower number. Nevertheless, Australia’s been at well below ‘replacement level’ for almost 50 years now, despite a COVID blip and a peak in the ‘baby bonus’ era 2008 – the only year with a fertility rate over 2 since 1976.
It's been falling consistently, and it’s unlikely we’ll ever see the level of fertility rates seen in the post-war baby boom, when rates were consistently over 3.0, and a peak of 3.55 in 1961.
Annotations by .id.
The total number of births registered in 2024 (292,318) was about 5,000 more than the previous year. The peak for number of births was 2018, with 315,147.
Much of the reason for the declining birth rate can be found in the average age of parents. The median age of mothers Australia-wide in 2024 was 32.1 years, while fathers averaged 33.9 years. These ages have risen substantially long-term but been more stable over the last 5 years or so. It’s likely they can’t go much higher, due to biological factors.
This chart shows the decline in fertility across age groups over the past 50 years. The units for ‘age specific fertility rate’ are births per 1,000 female population of that age. The only increases since 1975 are in the over 30’s groups. 50 years ago most women had their children before 30. Now it’s mostly after 30.
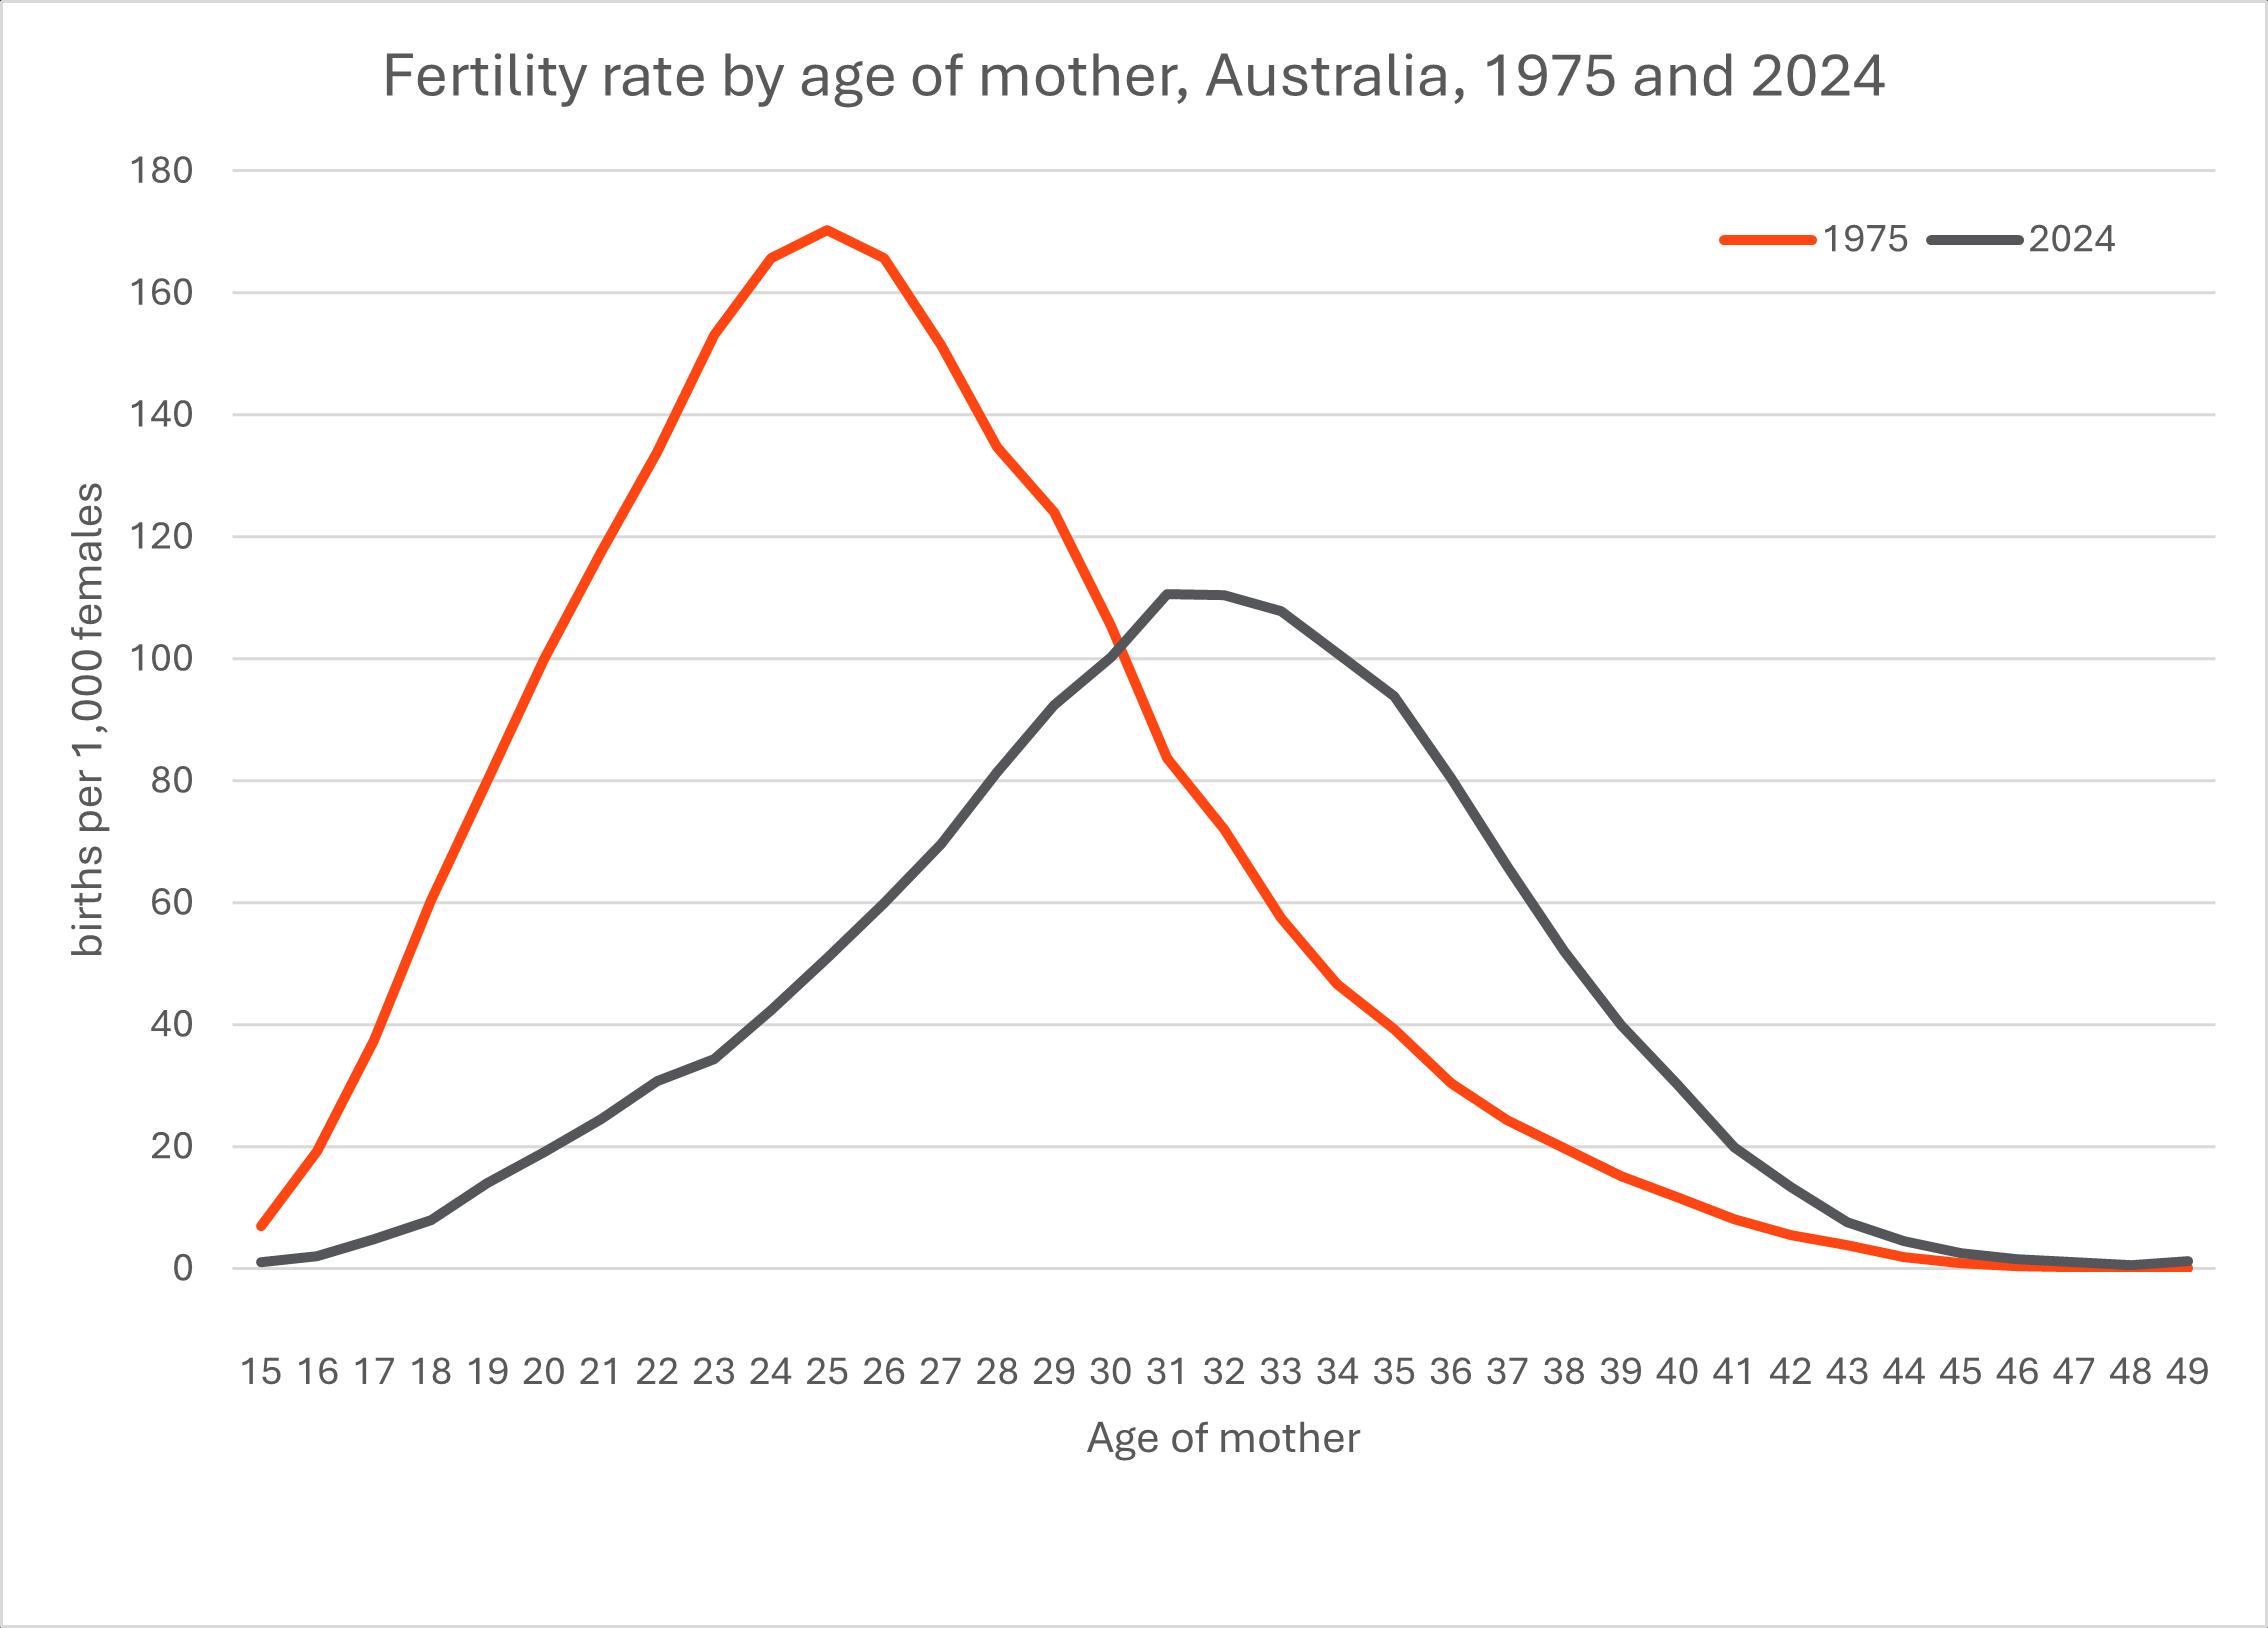
The magnitude of the drop in teenage and early 20s mothers is quite incredible. In 1975, the fertility rate for mothers aged 18 years was 60 (births/1000). In 2024 it’s 8 (same units). That’s almost an 8-fold fall, with similar drops seen in all the surrounding age groups. Fertility has increased for all ages over 32, but only 2-3 fold, so overall fertility is lower.
This fall is not likely to be biological. Instead it’s likely a combination of cultural factors. There are more women in the workforce, and the cost of living is higher, particularly in the last few years. Buying a family home now tends to require two incomes, so both parents need to work, and not every workplace has strong parental leave provisions.
There has also been a shift in cultural attitudes towards having children. Many families are pushing this later, and the availability of IVF and other medical interventions make it easier to have children later than it once was – but there are limits to how late it can go. From the chart you can see that fertility still drops to close to zero for women through their 40s, and is not measured at all after 49.
When we break down birth rates by local area, consistently the higher rates are in more regional and remote areas, with the lowest birth rates in the inner suburbs of our capital cities. This lends weight to the idea that housing prices may have a lot to do with it, but also job opportunities, which tend to be higher in cities, may be influencing things too.
The table below shows the increase in birth rates as you move more regionally. The classification is called 'Remoteness Areas' and it’s broadly based on distance from our largest population centres in Australia. Major Cities contains all the state capitals plus urban areas like Newcastle and the Gold Coast.
| Est. Resident Population | Births | Total fertility rate* | Median age of mother | |
|---|---|---|---|---|
| Major cities | 19,803,565 | 214,162 | 1.45 | 32.4 |
| Inner regional areas | 4,746,958 | 48,827 | 1.87 | 30.6 |
| Outer regional areas | 2,138,173 | 22,772 | 1.91 | 30 |
| Remote and very Remote | 505,582 | 6,557 | 1.92 | 29.3 |
| Australia Total | 27,204,809 | 292,318 | 1.54 | 31.9 |
Source: Australian Bureau of Statistics.
*Averaged over 3 years for statistical significance, will not match 2024 total rate.
There is a large population imbalance, with two thirds of our population being in those major cities, so despite having the lowest birth rate, the majority of births are to mothers residing in cities. There is a significant jump up in fertility as you move away from the cities, and a decrease in the average age of mother, but fewer actual births as the population is smaller, and often older too.
The map below shows 2024's birth rates by Local Government Area across Australia. You can see this shift visually moving out from the cities into more regional and remote areas. Zoom in to see differences in the cities, where the same pattern emerges. Lowest birth rates in the inner cities (many rates under 1), with higher rates in the outer suburbs and particularly fringe growth areas.
Birth rates by age, and specifically the number of births expected, are a key factor in developing .id’s population forecasts. We recently released our latest forecast update which predicted a stabilising low birth rate nationally.
The key is to zero in on your local area, as well as to understand the national, cultural changes we expect. Areas on the urban fringe and in regional areas where natural increase is a significant part of the population story will have a quite different forecast to inner city areas which mainly rely on migration. The age structure and household types in the population will be different too!
The .id population forecasts use this local nuance to tell a unique story for each place, helping you to plan and assess location intelligence with confidence.
Our specialists have deep expertise in demographics and spatial analysis, urban economics, housing research, social research and population forecasting

Head of Customer and Commercial (Gov.)

Senior Marketing Manager

Demographic Consultant

Client Engagement Manager (WA)

Lead Housing Consultant

Head of Product (Government)

Sales & Account Management (VIC/SA/TAS)

Views Delivery

Forecaster

Customer Success Manager

Customer Success Manager

